

Financing Capex
Free cash flow no longer covers capex. After recent capex, Meta, Oracle, Amazon and Alphabet all have negative free cash flow. Oracle is the extreme case, with capex at 174% of operating cash flow in FY2026.
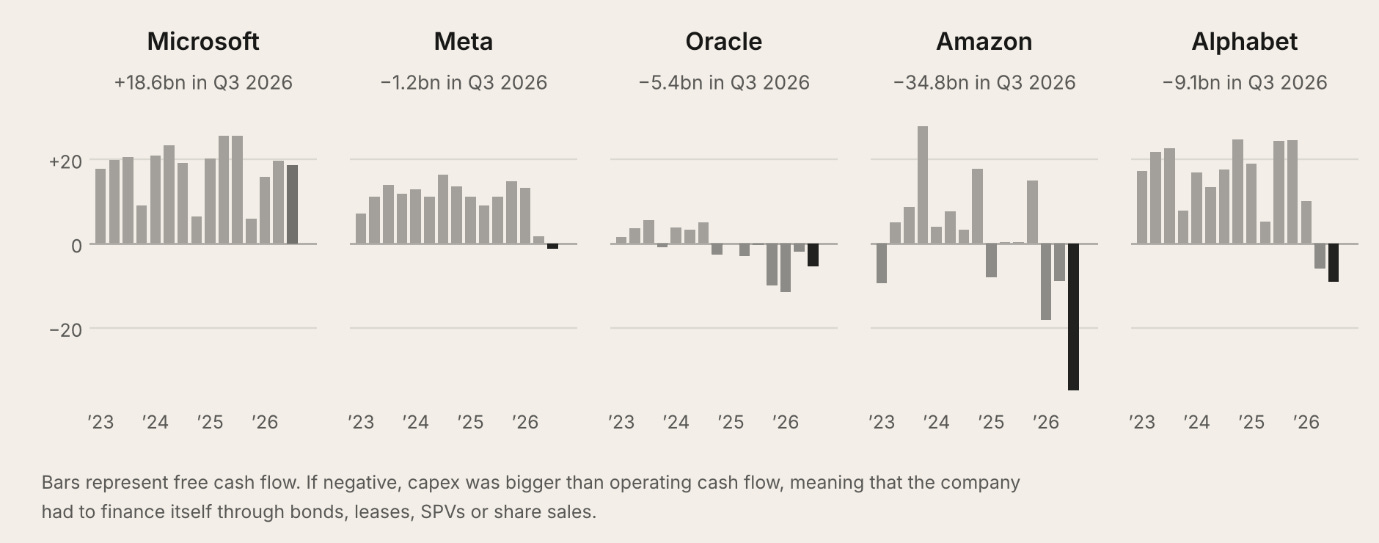
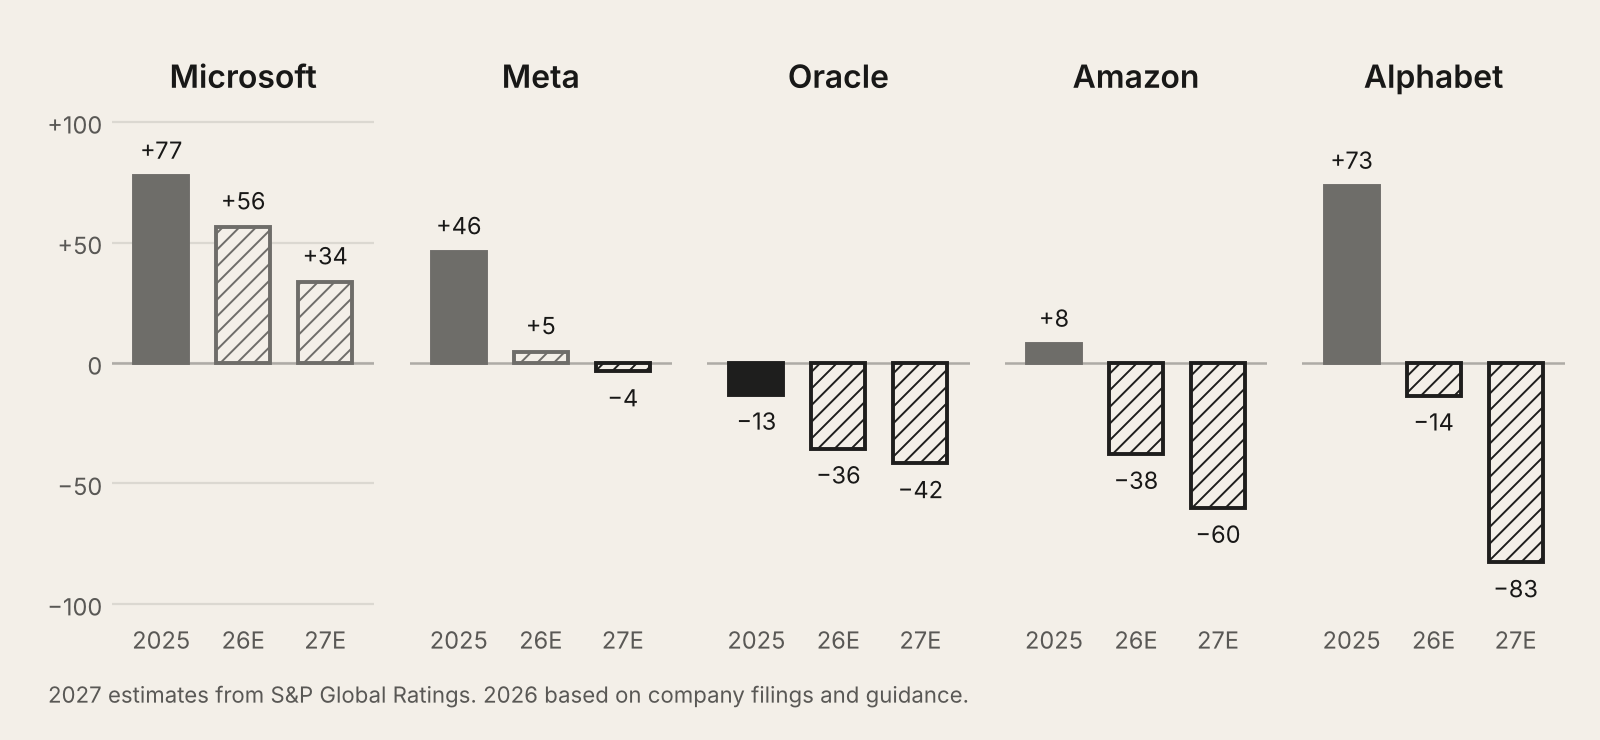
Forecasts show cash flow tightening further, with Oracle, Amazon and Alphabet the largest expected outflows. Oracle is the most exposed: its outflow is similar to the other two, but its market cap is about ten times smaller ($300bn vs $3tn).
Investment-grade bonds are the main funding source. Alphabet, Amazon, Meta, Microsoft, Oracle and SpaceX issued over $180bn by early September, largely long-dated (30-year) deals with strong demand (about 4x book cover). Issuance by the largest corporates is expected to grow 60% next year.
Off-balance-sheet structures are still in their infancy. In Meta’s Hyperion data centre, Meta owns 20% and Blue Owl (private credit) 80%. The venture is rated A+, one notch below Meta’s AA-, because Meta guarantees the rent and the residual value if it leaves the site early.
Class C shares raise capital without diluting voting rights. Once used mainly for employee pay, they are increasingly considered for capital raising, which lets companies cut buybacks.
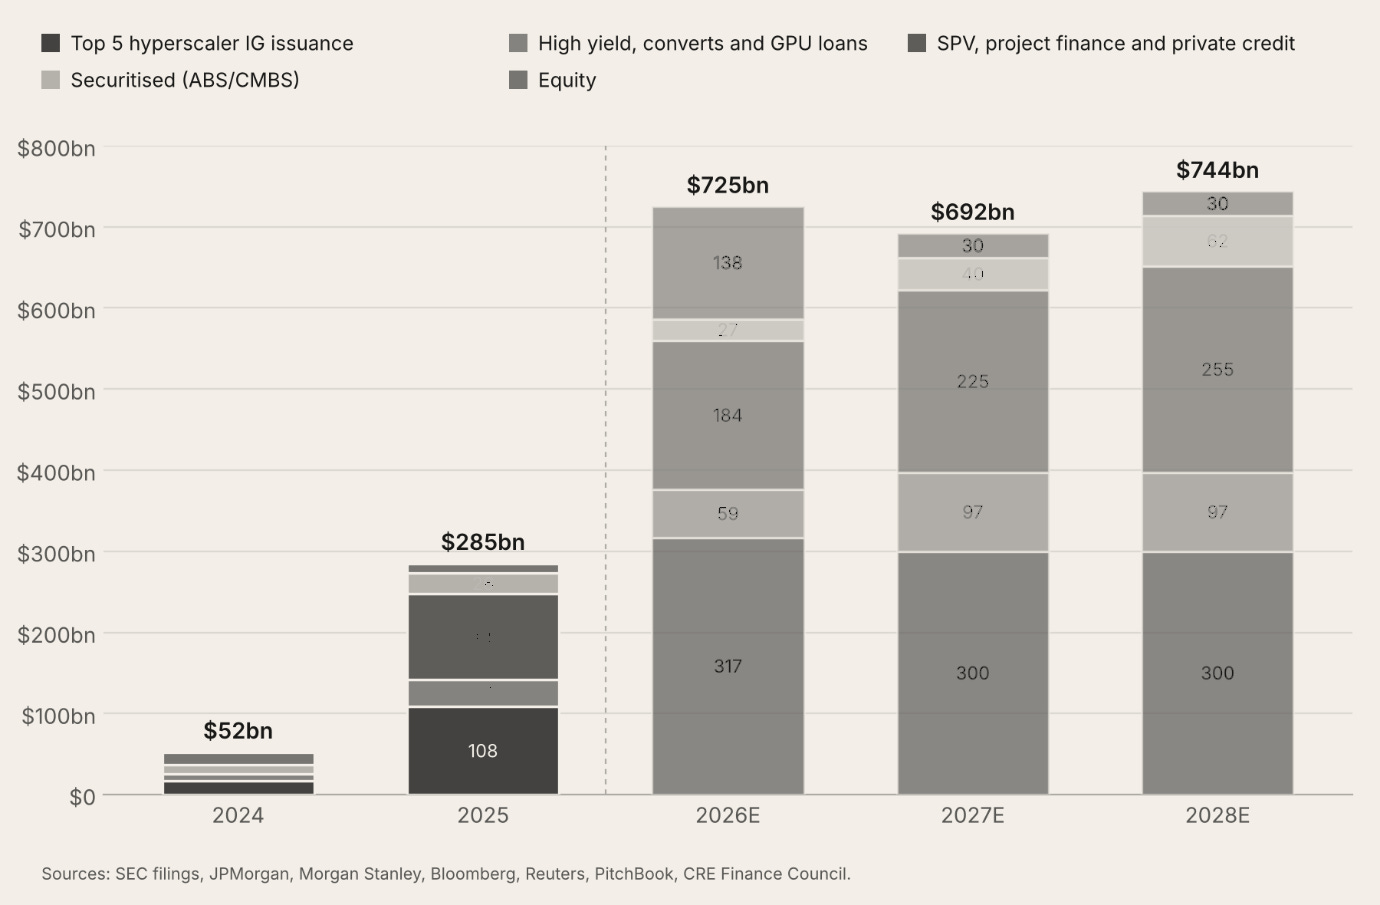
Public bonds stay at the forefront through 2028, but off-balance-sheet projects play a growing role.
What are Credit Markets Signalling?
The IG index (105bps) is at the upper end of its past-year range but well below the 135bps tariff-shock peak, and tight against 20 years of history. With major indices only 1–2% off all-time highs, weakness is isolated to a few names.
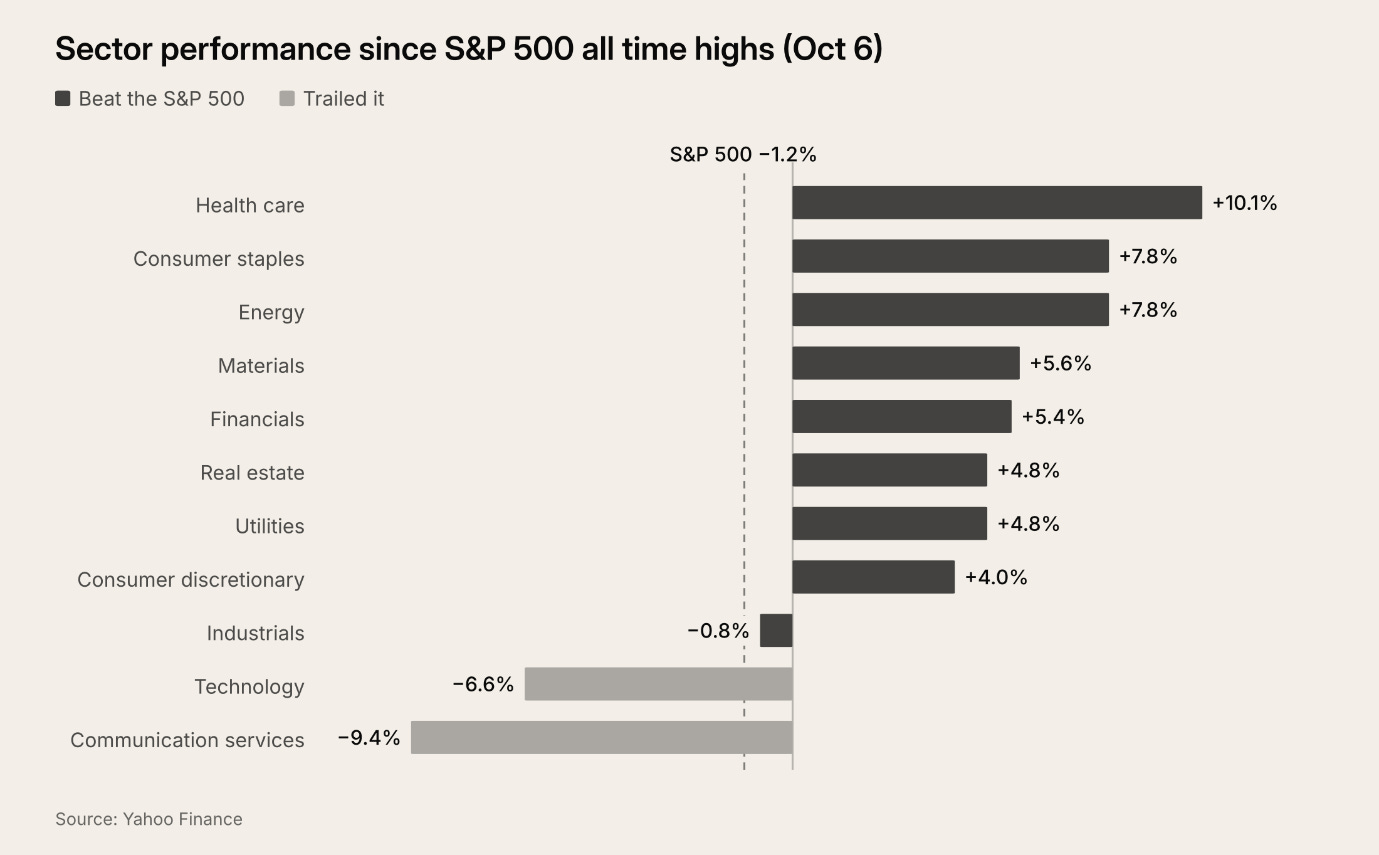
Equities show the same pattern: investors are rotating from capex-heavy names into defensives such as health care and staples. They are repositioning rather than withdrawing, so exiting risky names makes more sense than moving to cash.
As a rule, a (z-)spread above 100bps signals caution, as many pension and asset-manager investors step back. Above 150bps is high-yield territory, held mainly by specialist managers and hedge funds.
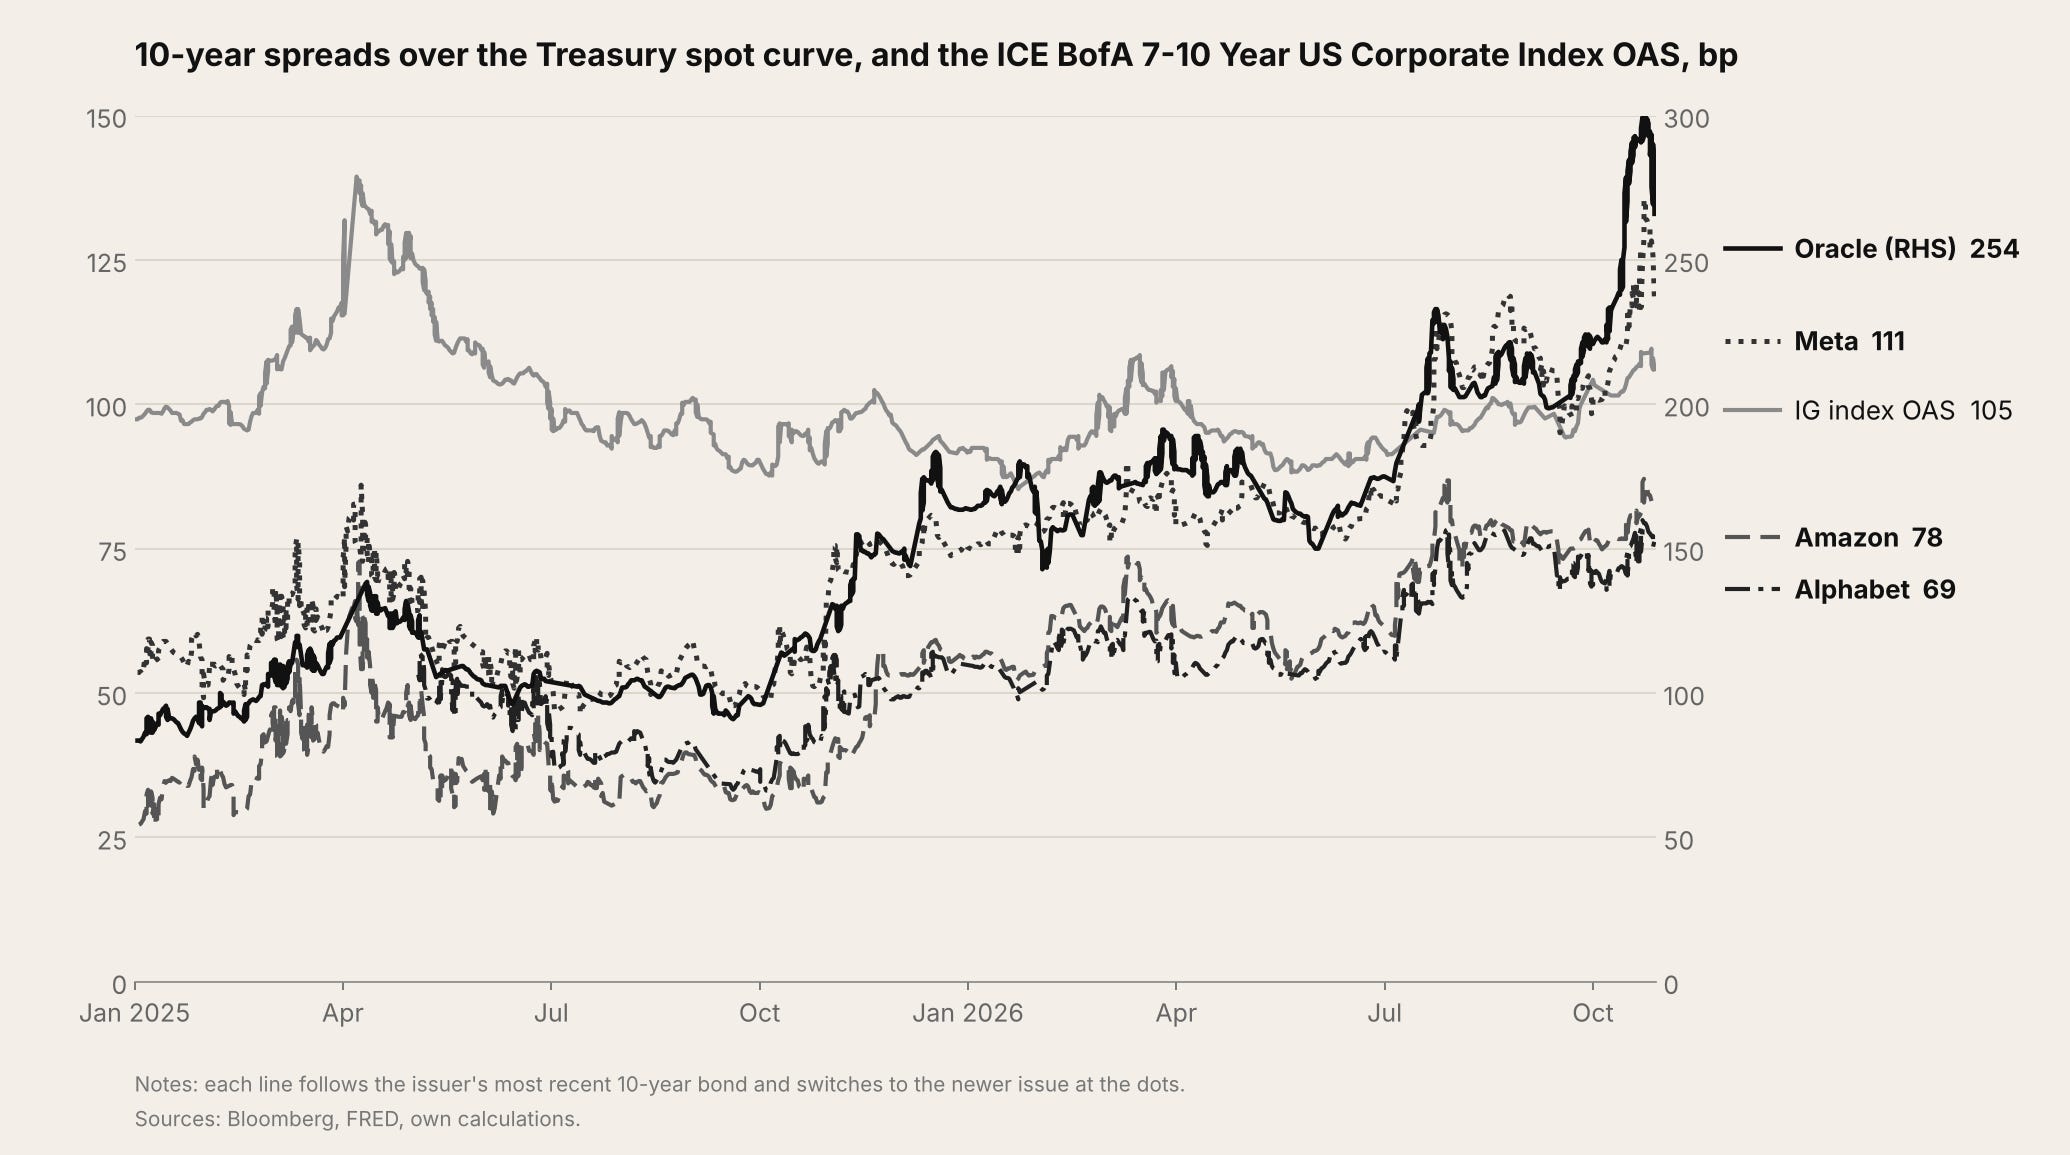
Spreads have trended up for about a year. Oracle and Meta are weakest, especially over the past month, while Amazon and Alphabet are stable and somewhat high but reasonable. Meta looks increasingly risky, and Oracle’s investor base narrowed as its spreads widened. For names above 100bps, and especially 150bps, it only makes sense to be positive once fundamentals turn: positive cash flow, falling debt-to-EBITDA, and spreads tightening against the index.
Credit is likely to see the same rotation as equities, away from weak funding outlooks and towards strong cash flow, whether within the sector (Microsoft) or outside it (health care, utilities). This also explains the IG index’s stability. Notably, in late April/May equities rose on the US–Iran peace deal while credit spreads widened. Spreads normally fall when equities rise, so capex concerns are the likely cause.
The Impact of Rates, Oil and Inflation
Rates
(i) Goldman expects $420bn of hyperscaler issuance in 2027, so a 100bps rise in the 10-year (to about 6%) adds roughly $4bn a year of interest against $778bn of combined operating cash flow, which is unlikely to change capex plans.
(ii) Higher discount rates compress multiples, and Class C issuance needs a strong market to keep dilution painless.
(iii) Off-balance-sheet vehicles are the most rate-sensitive, pricing about 100bps over IG and 200bps over HY equivalents, so smaller hyperscalers feel it first.
Oil
(i) Oil is not a direct data-centre input; US power tracks gas and electricity.
(ii) Construction and logistics would feel second-order pressure, making new projects harder to justify.
(iii) Gulf investment vehicles fund a non-trivial share of AI projects, and oil-driven changes could reduce that capital.
Inflation
(i) Component costs and delivery delays raise capex itself: Amazon lifted its 2026 plan from $200bn to $220bn on memory costs.
(ii) Persistent inflation keeps policy tight and long yields high, hurting fundraising, mainly through rate-sensitive off-balance-sheet vehicles.
Capex Slowdown in Focus: AMD, NVIDIA, TSMC
Two scenarios versus expectations: (A) expected capex cut 20%, financing tightens; (B) cut 45%, with no off-balance-sheet vehicles. Percentages are versus expectations, not current figures.
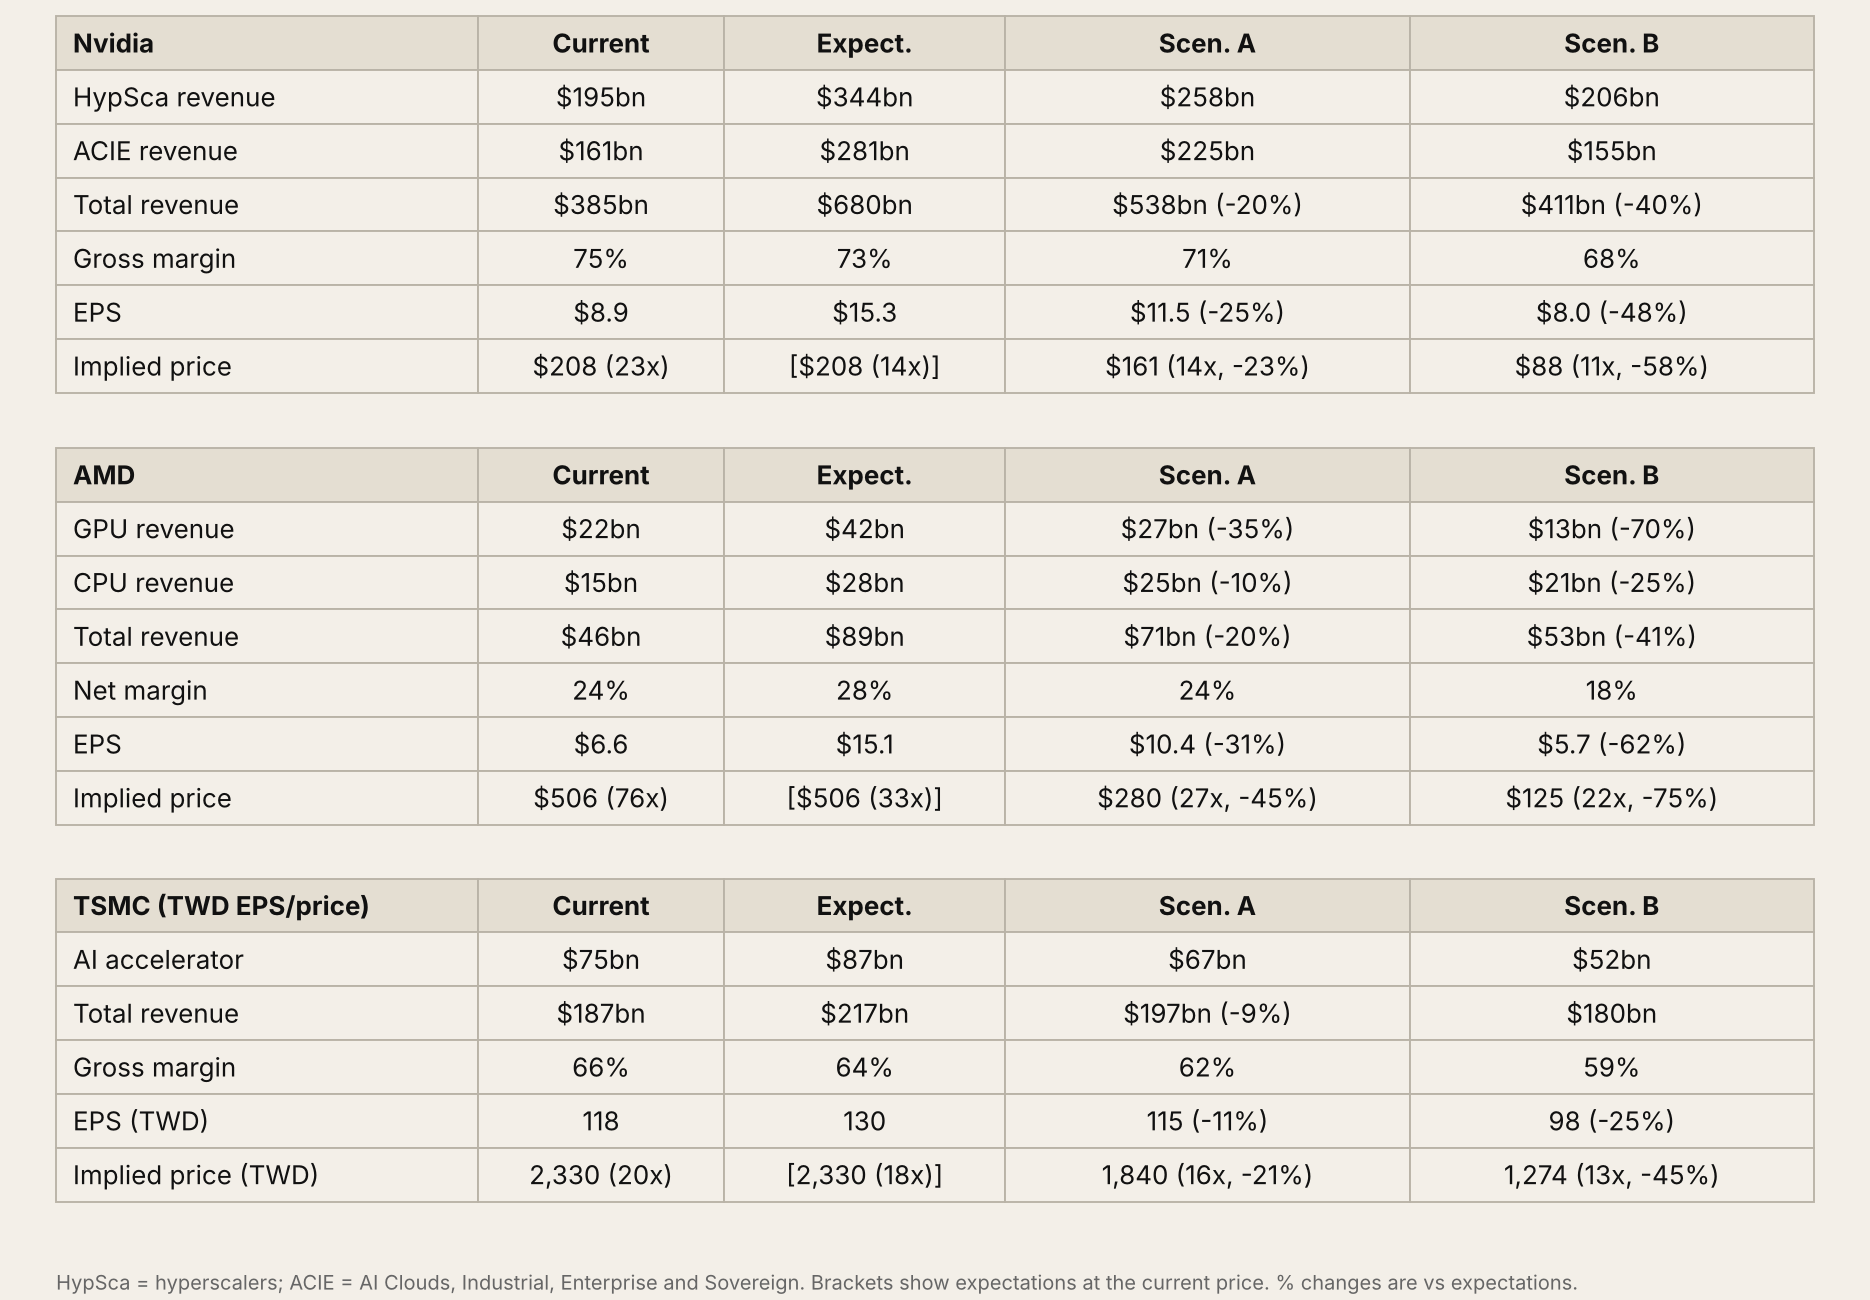
In Scenario A all three miss expectations but revenue still grows year on year; the damage comes from the miss, not falling sales. AMD, with the most operational and valuation leverage, suffers most. In Scenario B revenues flat-line at current run-rates. AMD is again most exposed, as its GPU line depends on a ramp with financing-sensitive customers, while TSMC is more defensive given its wider customer base.
Indicators to Monitor
(i) Nasdaq 100 below its 200-day average (macro): two weekly closes. In the dotcom bust the index fell 30% to the average, then a further 75% (83% in total); in the financial crisis 10%, then a further 46% (52% in total). Reducing risk on confirmation below the average avoids the largest part of drawdowns, a further 61% on average.
(ii) US 10-year yield at 6% (macro): with a 100bps spread, funding costs reach 7% and deals may be pulled. The direct cost is modest relative to cash flow, but investors turn cautious, and off-balance-sheet vehicles and Class C issuance would likely become unavailable.
(iii) Bond book coverage below 2x (macro): coverage is currently 3.5–4x. Between 2.5x and 3x is still decent, 2x or below signals worry, and below 1.5x a deal may be pulled.
(iv) Oracle 5-year CDS above 500bps (micro): CoreWeave trades above 1,000bps, leaving only specialist and distressed funds. Oracle ($300bn market cap vs CoreWeave’s $30bn) is a better barometer of large-cap credit stress. Its current 300bps is high but still acceptable to regular credit funds; 500bps would signal a possible point of no return, with many investors exiting.
If you enjoyed this article and found it insightful, subscribe for free below.