

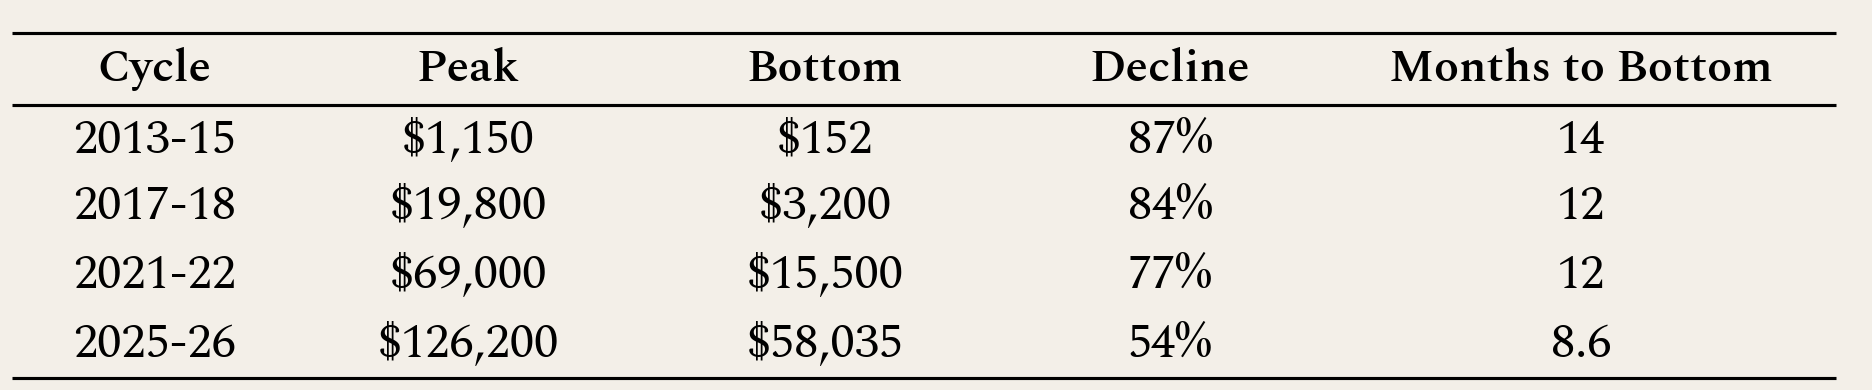
2026 has always been seen by the Bitcoin community as a bear year. As with previous bear markets, the year aligns with both the US mid-term elections (historically the weakest for US equity markets) and half-way through a halving cycle. The low this June of $58,035 occurred just 262 days after a record high of $126,198 in October.
In previous cycles, the bottom occurred both at a longer time after the peak, and at a greater drawdown. Did Bitcoin put in its cycle low early, and if so, why? This article examines the historical template, what may have changed structurally, works through a checklist of bottom indicators, and assesses what the evidence means for risk-reward from here.
I. The Historical Template
The four-year cycle theory is well established and widely followed in the Bitcoin community. It suggests that a complete cycle occurs every four years. In general, the peaks occur two years after the halving and coincide with post-election years (such as 2017, 2021), while the bottoms occur three years after the halving, in mid-term election years (such as 2018 and 2022). Notably the bitcoin low occurs in, what is on average, the weakest performing S&P 500 year (mid-term elections).
Before assessing bear market drawdowns, it can be helpful to look at the cause and size of bull markets (typically lasting three years from the halving). One of the most followed studies is the stock-to-flow model. It is a valuation and economic tool that measures the scarcity of a resource by comparing its existing supply to its annual production rate. It is most famously used for precious metals, such as gold and silver, and has been popularised in recent years as a predictor for the price of Bitcoin.
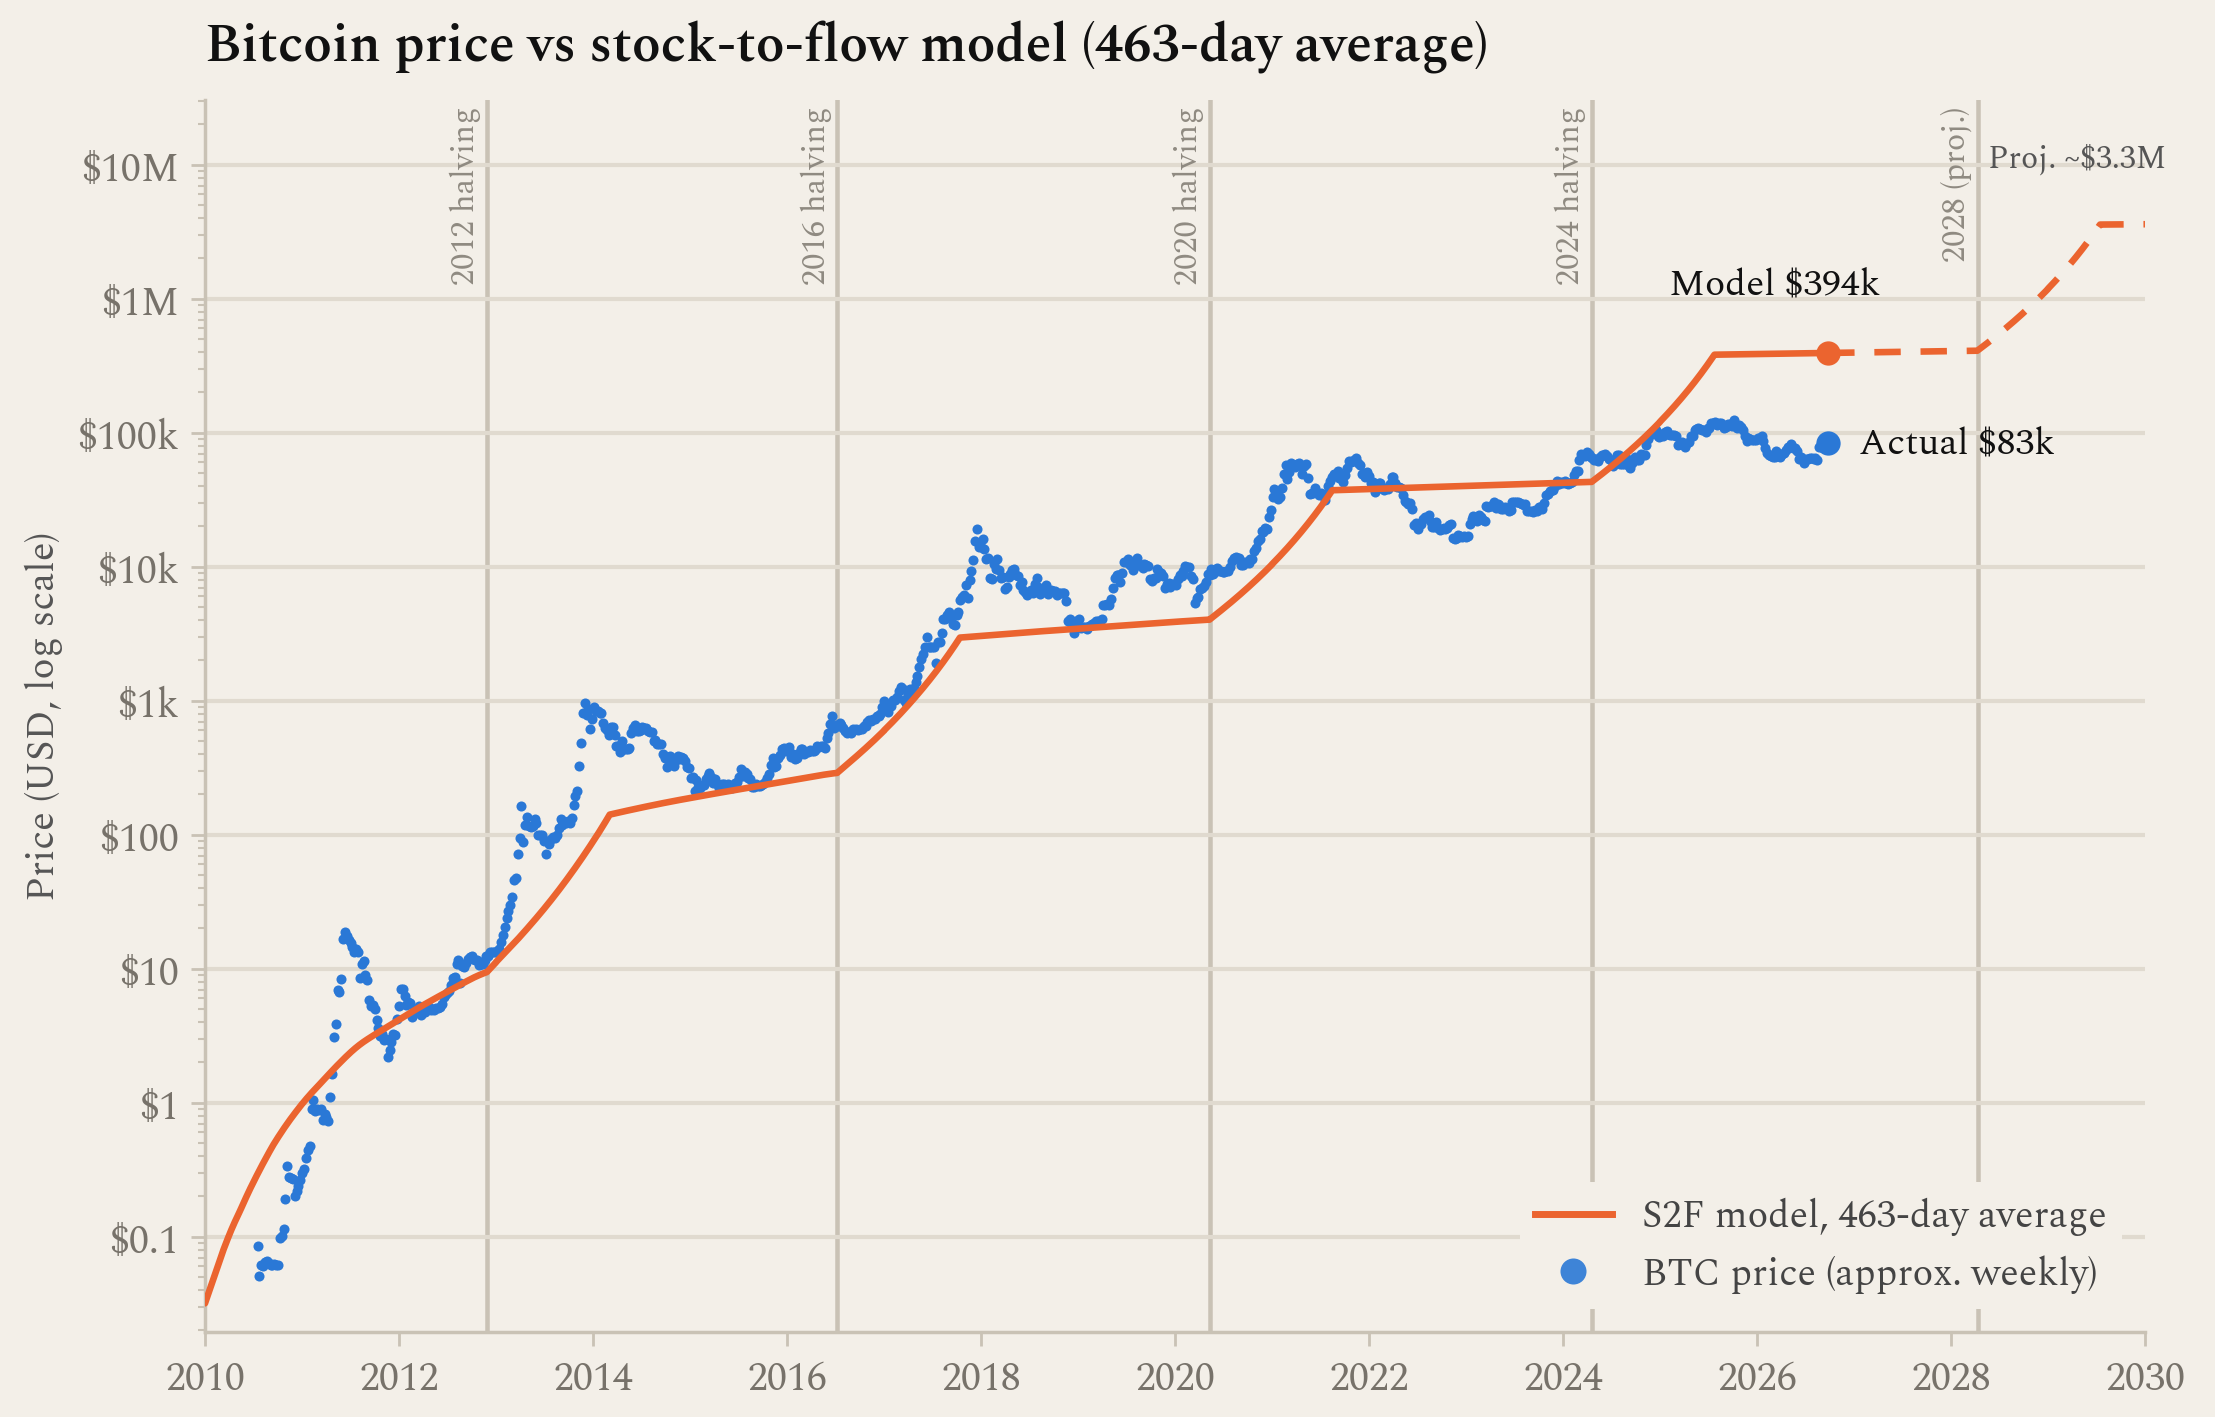
The model (see chart below) suggests that as a direct result of the halving (a reduction in block rewards by half), the price should subsequently rise as Bitcoin becomes firstly scarcer in production, and secondly, more expensive to produce. As seen on the chart, in previous bull markets the price exceeded the model output, suggesting that a sharp drawdown may follow from an over-hyped market rather than a fundamental reset. The latest bull run, which topped around $126k, fell far short of the model projection. This suggests that a sharp drawdown was not necessary given there was not enough euphoria to bring it to the predicted value in the first place.
Another characteristic of previous bear markets has been both the duration and drawdown. Prior to this cycle, declines from peak to bottom ranged from 77% to 87% while the months this took to occur ranged between 12 and 14 months. While the magnitude of these declines marginally with each additional cycle, the metrics for the potential current bear market bottom (54% drawdown, 9 months) certainly looks like an outlier.
II. Is this cycle structurally different?
The case for a shorter, shallower bear market rests on a changed holder base rather than a changed asset. Since the launch of BlackRock’s iShares Bitcoin ETF in January 2024 (the largest spot ETF), the total held by ETFs is approximately 6.4% of the total supply, equating to roughly $110bn. Additionally, corporate treasuries (such as Strategy) also hold vast quantities. While spot bitcoin holders might trade their positions around the four year cycles, the ability to add Bitcoin exposure to long-term savings plans (such as 401k and SIPPs) via these vehicles mean there is increased likelihood of dollar-cost-averaging, and therefore less imbalance of flows during bear markets. As a result, this reduces the volatility over medium to long timeframes.
The regulatory landscape over the past few years has also changed. Retail’s ability to use leverage on crypto-specific exchanges has been reduced significantly, alongside the introduction of regulated financial vehicles which allow the same retail to enter the market (such as via an ETF or Strategy). Instead of trading leverage, these retail accounts then turn to spot accounts which may well then result in lower turnover of positions. In turn, this may lead to reduced susceptibility to large swings or drawdowns. Leverage has not all disappeared though. The 10th of October 2025 crash, driven by a multitude of crypto-specific and macro factors, forced about $19 billion of liquidations. The main argument here has been that this flushed away a lot of the leverage and many traders exited.
III. Could history end up rhyming?
There is a checklist of bottom indicators which one can use to assess whether the bottom is in. The indicators may not trigger all at once, and some may not even trigger at all. Therefore, assessing that enough have triggered is good enough to suggest that the risk-reward then favours upside rather than further downside.
Realised price, which is the average price at which every bitcoin was last moved on-chain (and calculated as dividing the total value of all bitcoins at the price of their last blockchain movement by the total supply), has been breached just before every major low since 2011. Yet the recent June low remained 8.6% above it, indicating the bottom is not yet in.
Another popular metric, the MVRV Z-Score (calculated as the current market value minus the realised value, divided by the standard deviation of the market value), has either gone to, or below, zero at every cycle bottom. This time it remained above, reading 0.24 in early June, and again suggesting the bottom is still to come.
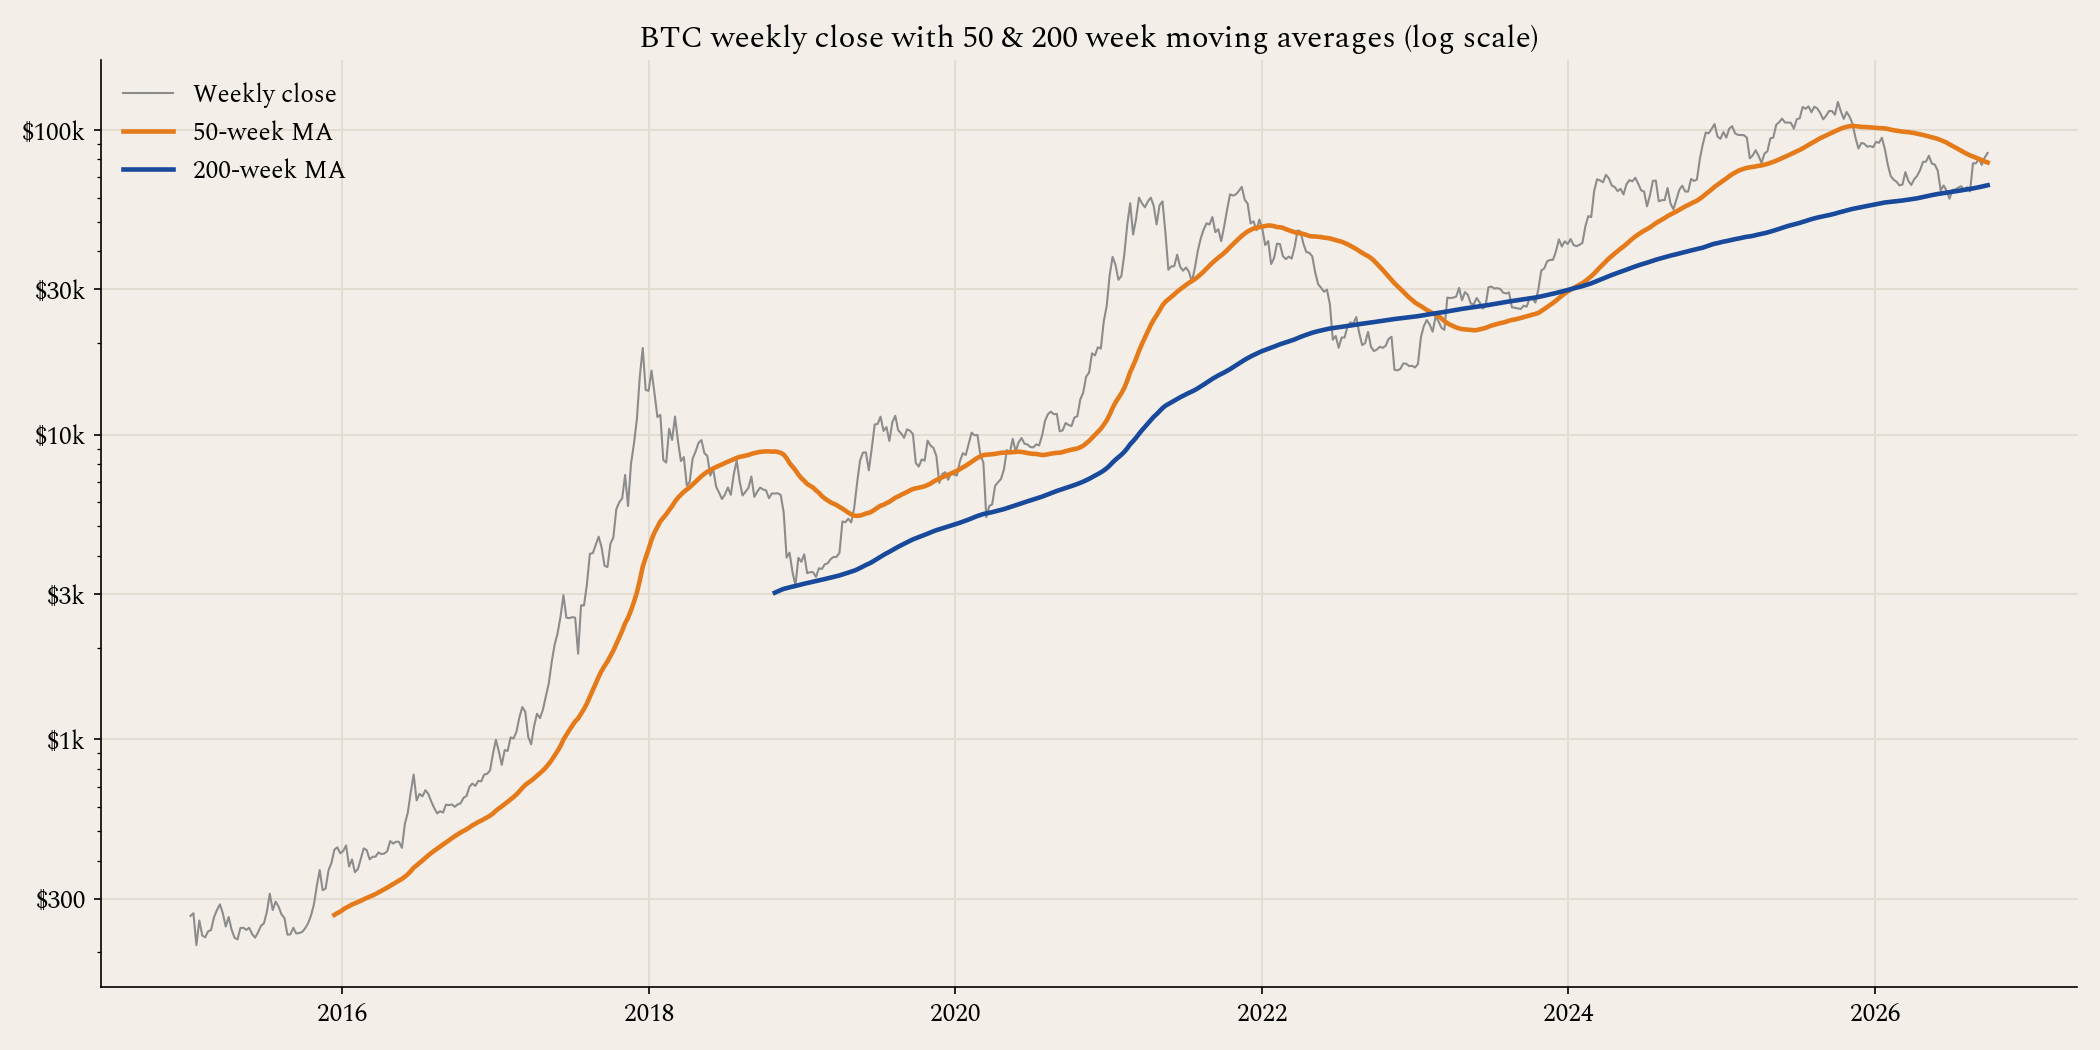
Several other indicators, however, have instead flagged that the bottom may be in. Sentiment hit a low of 12 on the Fear and Greed Index during the lows of June. SOPR, a measure of whether short-term investors are selling their holdings at a profit or loss, fell below 1 in the first quarter of this year, meaning that they were selling at a loss. A reading like this was seen at the 2018 and 2022 lows. Additionally, during late June the weekly close fell below the 200-week moving average, the first such close since 2022. Meanwhile, miners endured one of the longest capitulations on record, with price trading below their estimated production cost of about $66k. As a bottom signal, this suggests that miners would turn off their machines, a characteristic of previous bottoms.
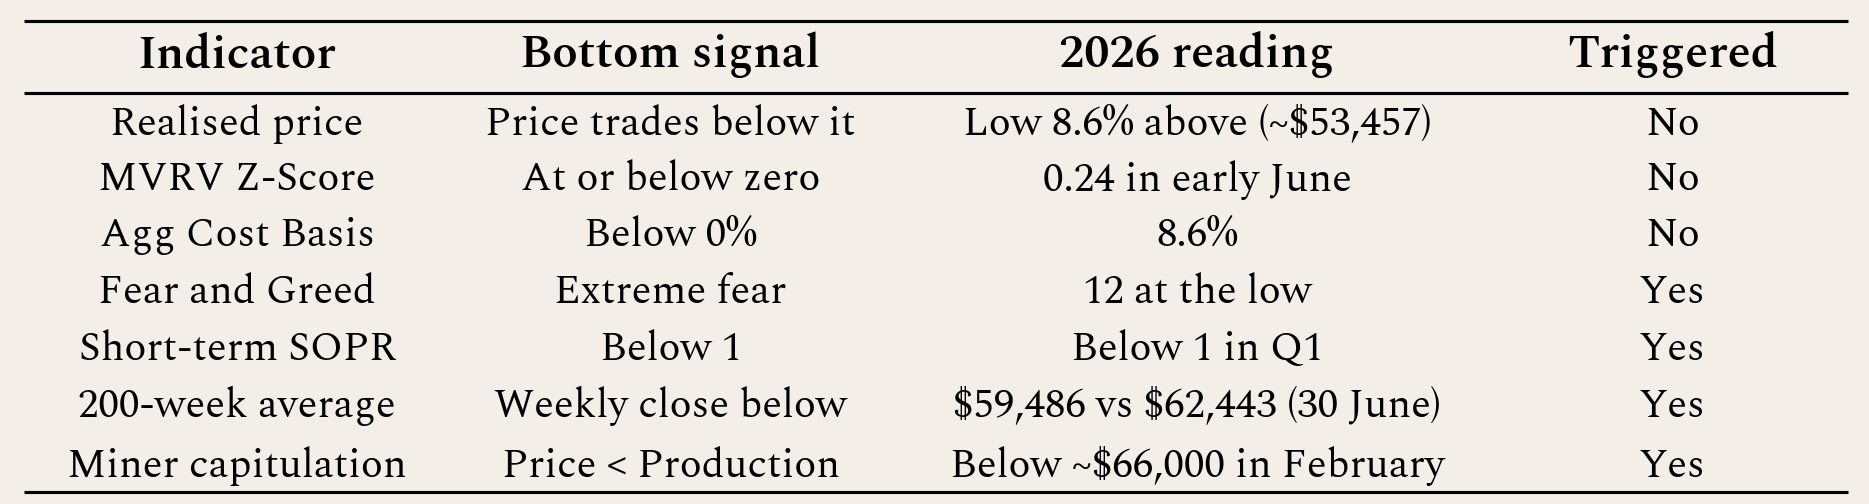
Overall, when it comes to reading bottom signals, those valuation metrics which previously worked well in bear markets didn’t trigger this time (realised price, MVRV and aggregate cost price). However, the Fear and Greed, and miner-stress signals did trigger. One can argue this is a function of a maturing market where sentiment still wobbles, but the degree of price movement is dampened with progressive time and cycles as the asset class becomes more established and increasingly held by institutional accounts.
Asking whether the bottom is in also begs the question of whether the paradigm has shifted from bear to bull market. We can return to the analysis of the 50-week moving average for this. Historically, when a weekly close has moved back above the 50-week moving average during a bear market, it has usually marked the bottom for that cycle. Bitcoin closed above its 50-week average, currently near $78,100, on 21 September for the first time in 45 weeks. Based on this, one could argue the low of $58k is in and we should not see prices here again. However, this does not negate the possibility of a drop from current prices to somewhere above this level.
IV. Conclusion
Overall, the price movement of the past three months suggests that the low is in for the current cycle. One could therefore start seeing the current situation as the formation of a new bull trend rather than a continuation of the bear. While a significant market downturn (such as a 20-30% decline in equity markets, or an even more extreme crash such as the COVID shock) could derail this, there aren’t enough pointers at present to suggest this is the case. History does not repeat itself, but it does rhyme. The extent to which it rhymes will depend on other factors, such as the state of the macro economy.
If you enjoyed this article and found it insightful, subscribe for free below.